
PEPE price has slipped about 3% over the past 24 hours, but the bigger picture still looks strong at first glance. The token is up nearly 84% from its late December low and around 62% over the past seven days, making it one of the strongest-performing meme coins this week.
However, zooming out adds caution. PEPE is still down roughly 32% over the past three months, showing the broader downtrend has not fully disappeared. The recent surge looks powerful, but several signals suggest this rally may be fragile rather than stable. Below are three reasons why PEPE’s sharp move higher could reverse just as fast.
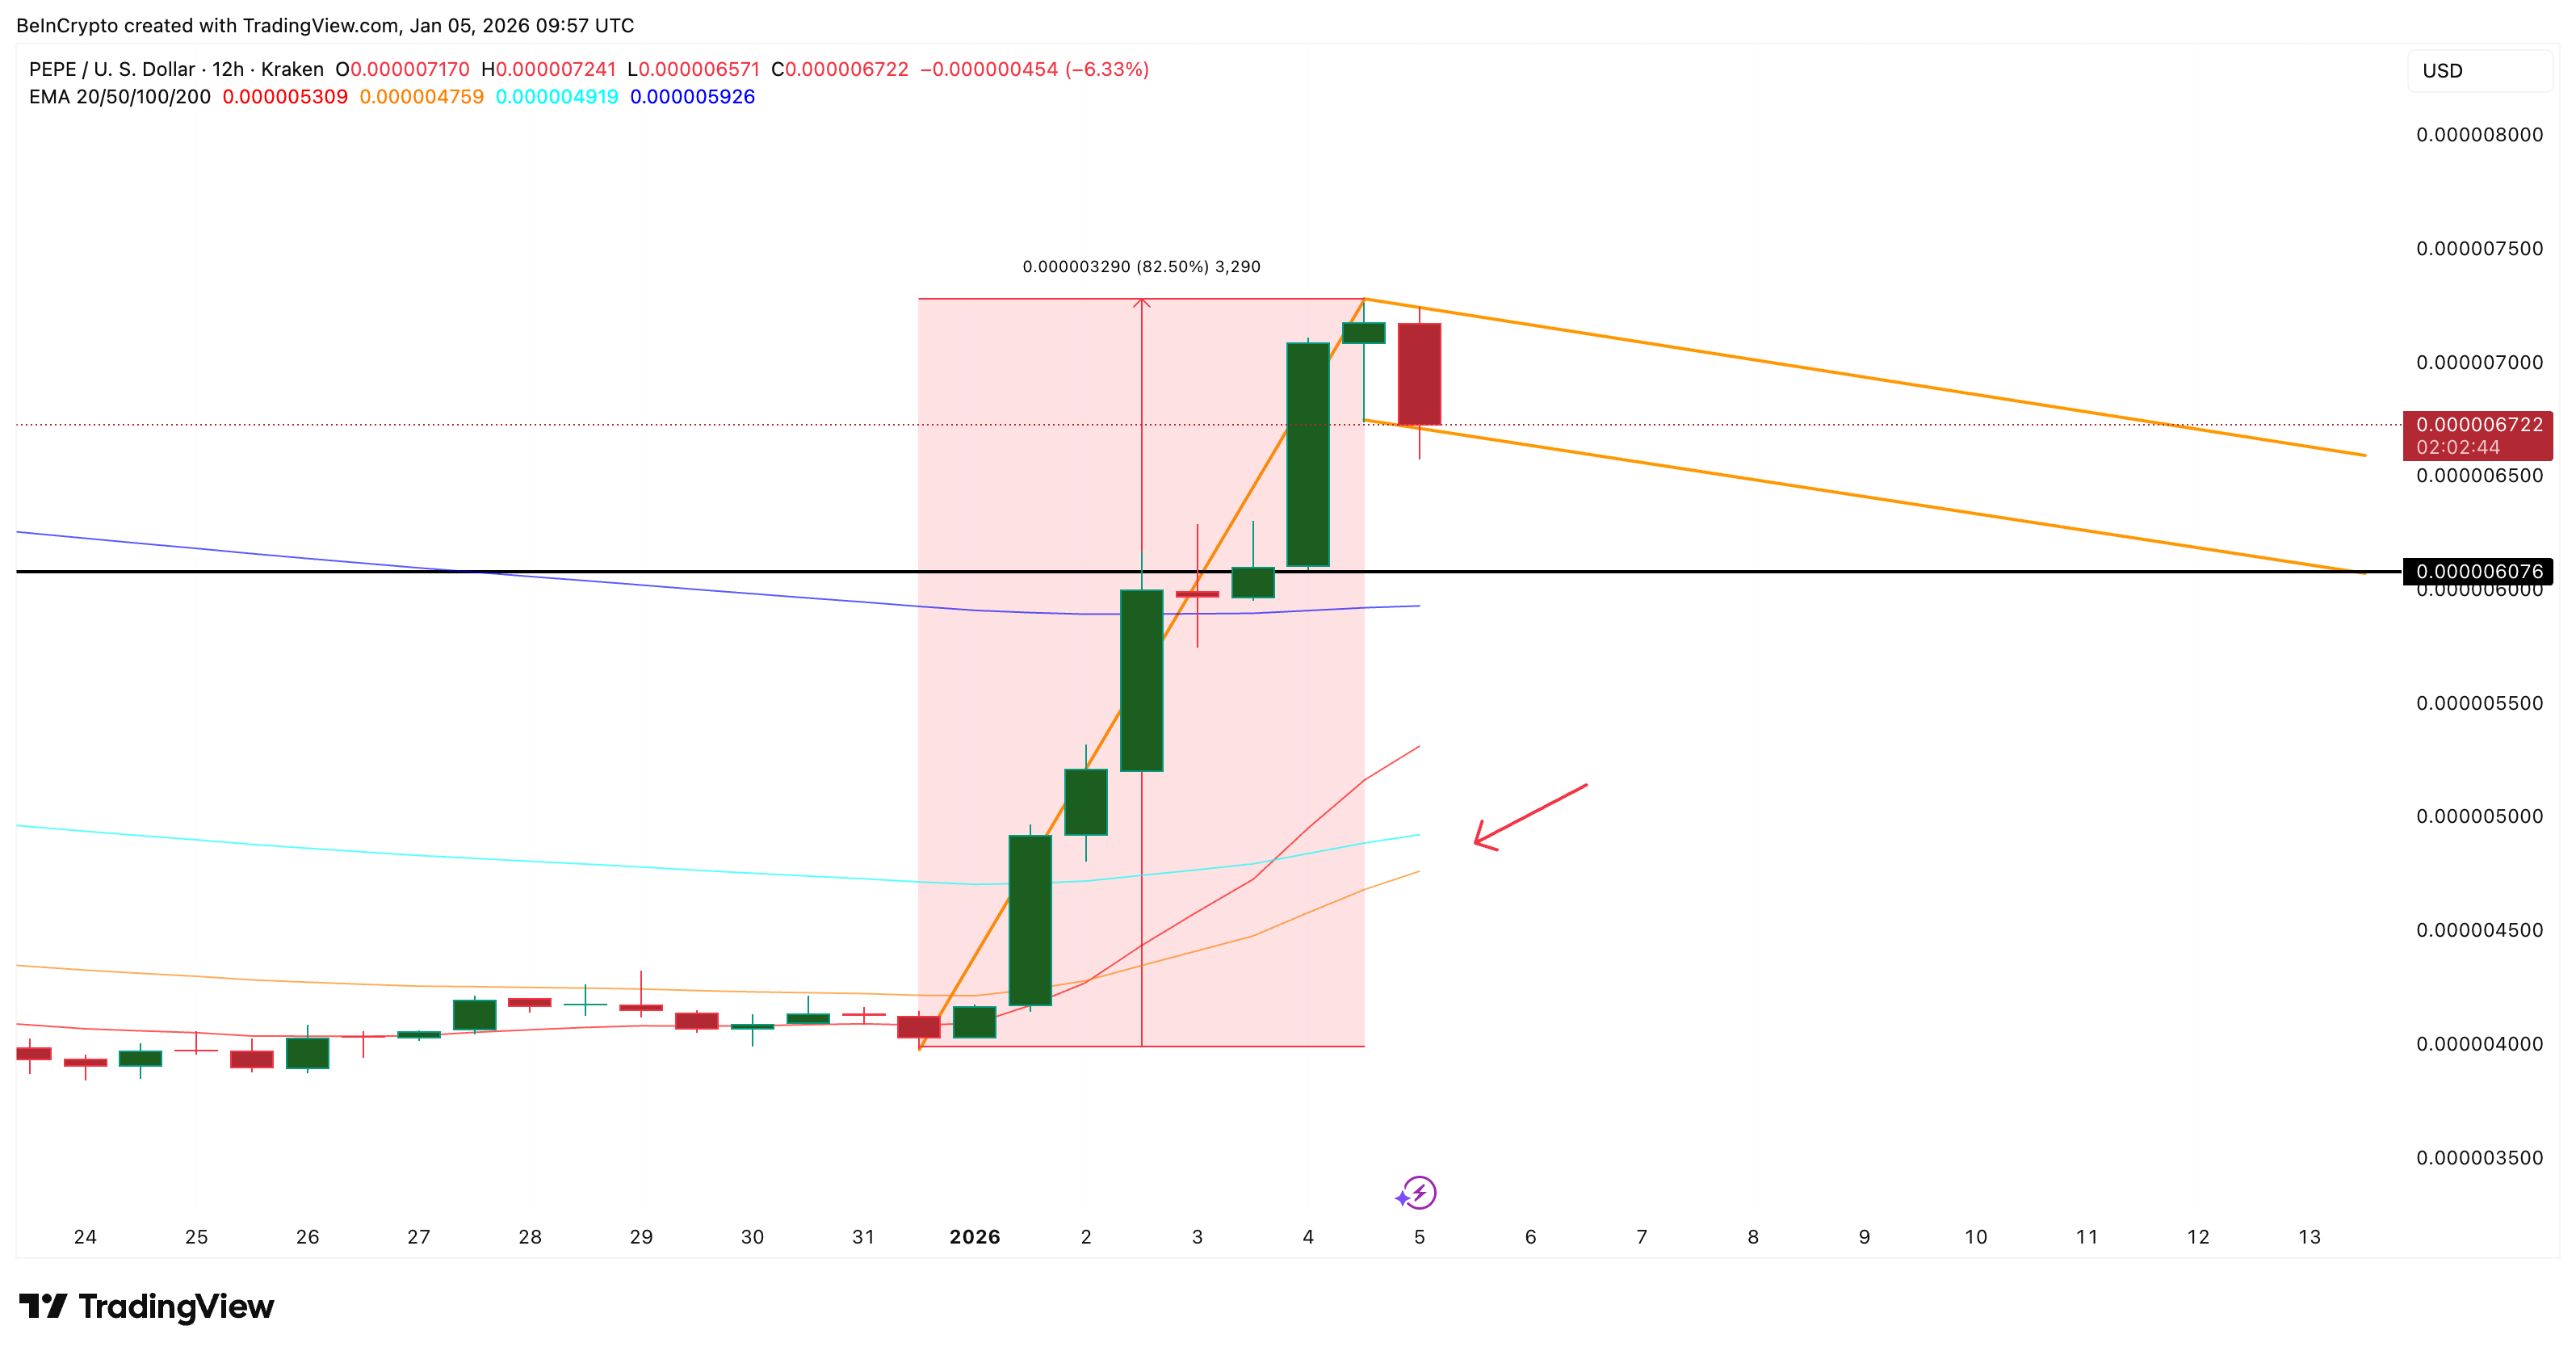
Flag and EMA Setup Look Bullish at First Glance
On the 12-hour chart, PEPE price is forming what looks like a classic bull pole and flag structure. A bull flag forms when price rallies sharply, then moves sideways or slightly lower to cool off before another potential push higher. This often attracts momentum traders looking for continuation.
The moving averages add to that optimism. The 50-period exponential moving average (EMA), which reacts faster to price changes, is closing in on the 100-period EMA. EMAs smooth price action, and when shorter EMAs move above longer ones, traders often read it as a trend shift in progress.
Want more token insights like this? Sign up for Editor Harsh Notariya’s Daily Crypto Newsletter here.
This setup explains why buying interest might be coming in from traders, who might expect the price correction to be a dip buying opportunity. Traders see consolidation as healthy rather than bearish.
But this structure only stays valid if key levels hold. As long as the PEPE price remains above roughly $0.0000060, the flag structure is technically intact. Below that, the bullish setup starts to weaken quickly.
PEPE Whales Are Selling Into Strength as Coin Movement Surges
While the chart looks constructive, on-chain behavior tells a very different story.
PEPE whales have been steadily reducing exposure since late December. On December 29, large holders controlled roughly 136.71 trillion PEPE. That figure has now dropped to about 133.85 trillion PEPE, a reduction of nearly 2.86 trillion tokens. At current prices, that represents roughly $20 million worth of supply distributed into the market.
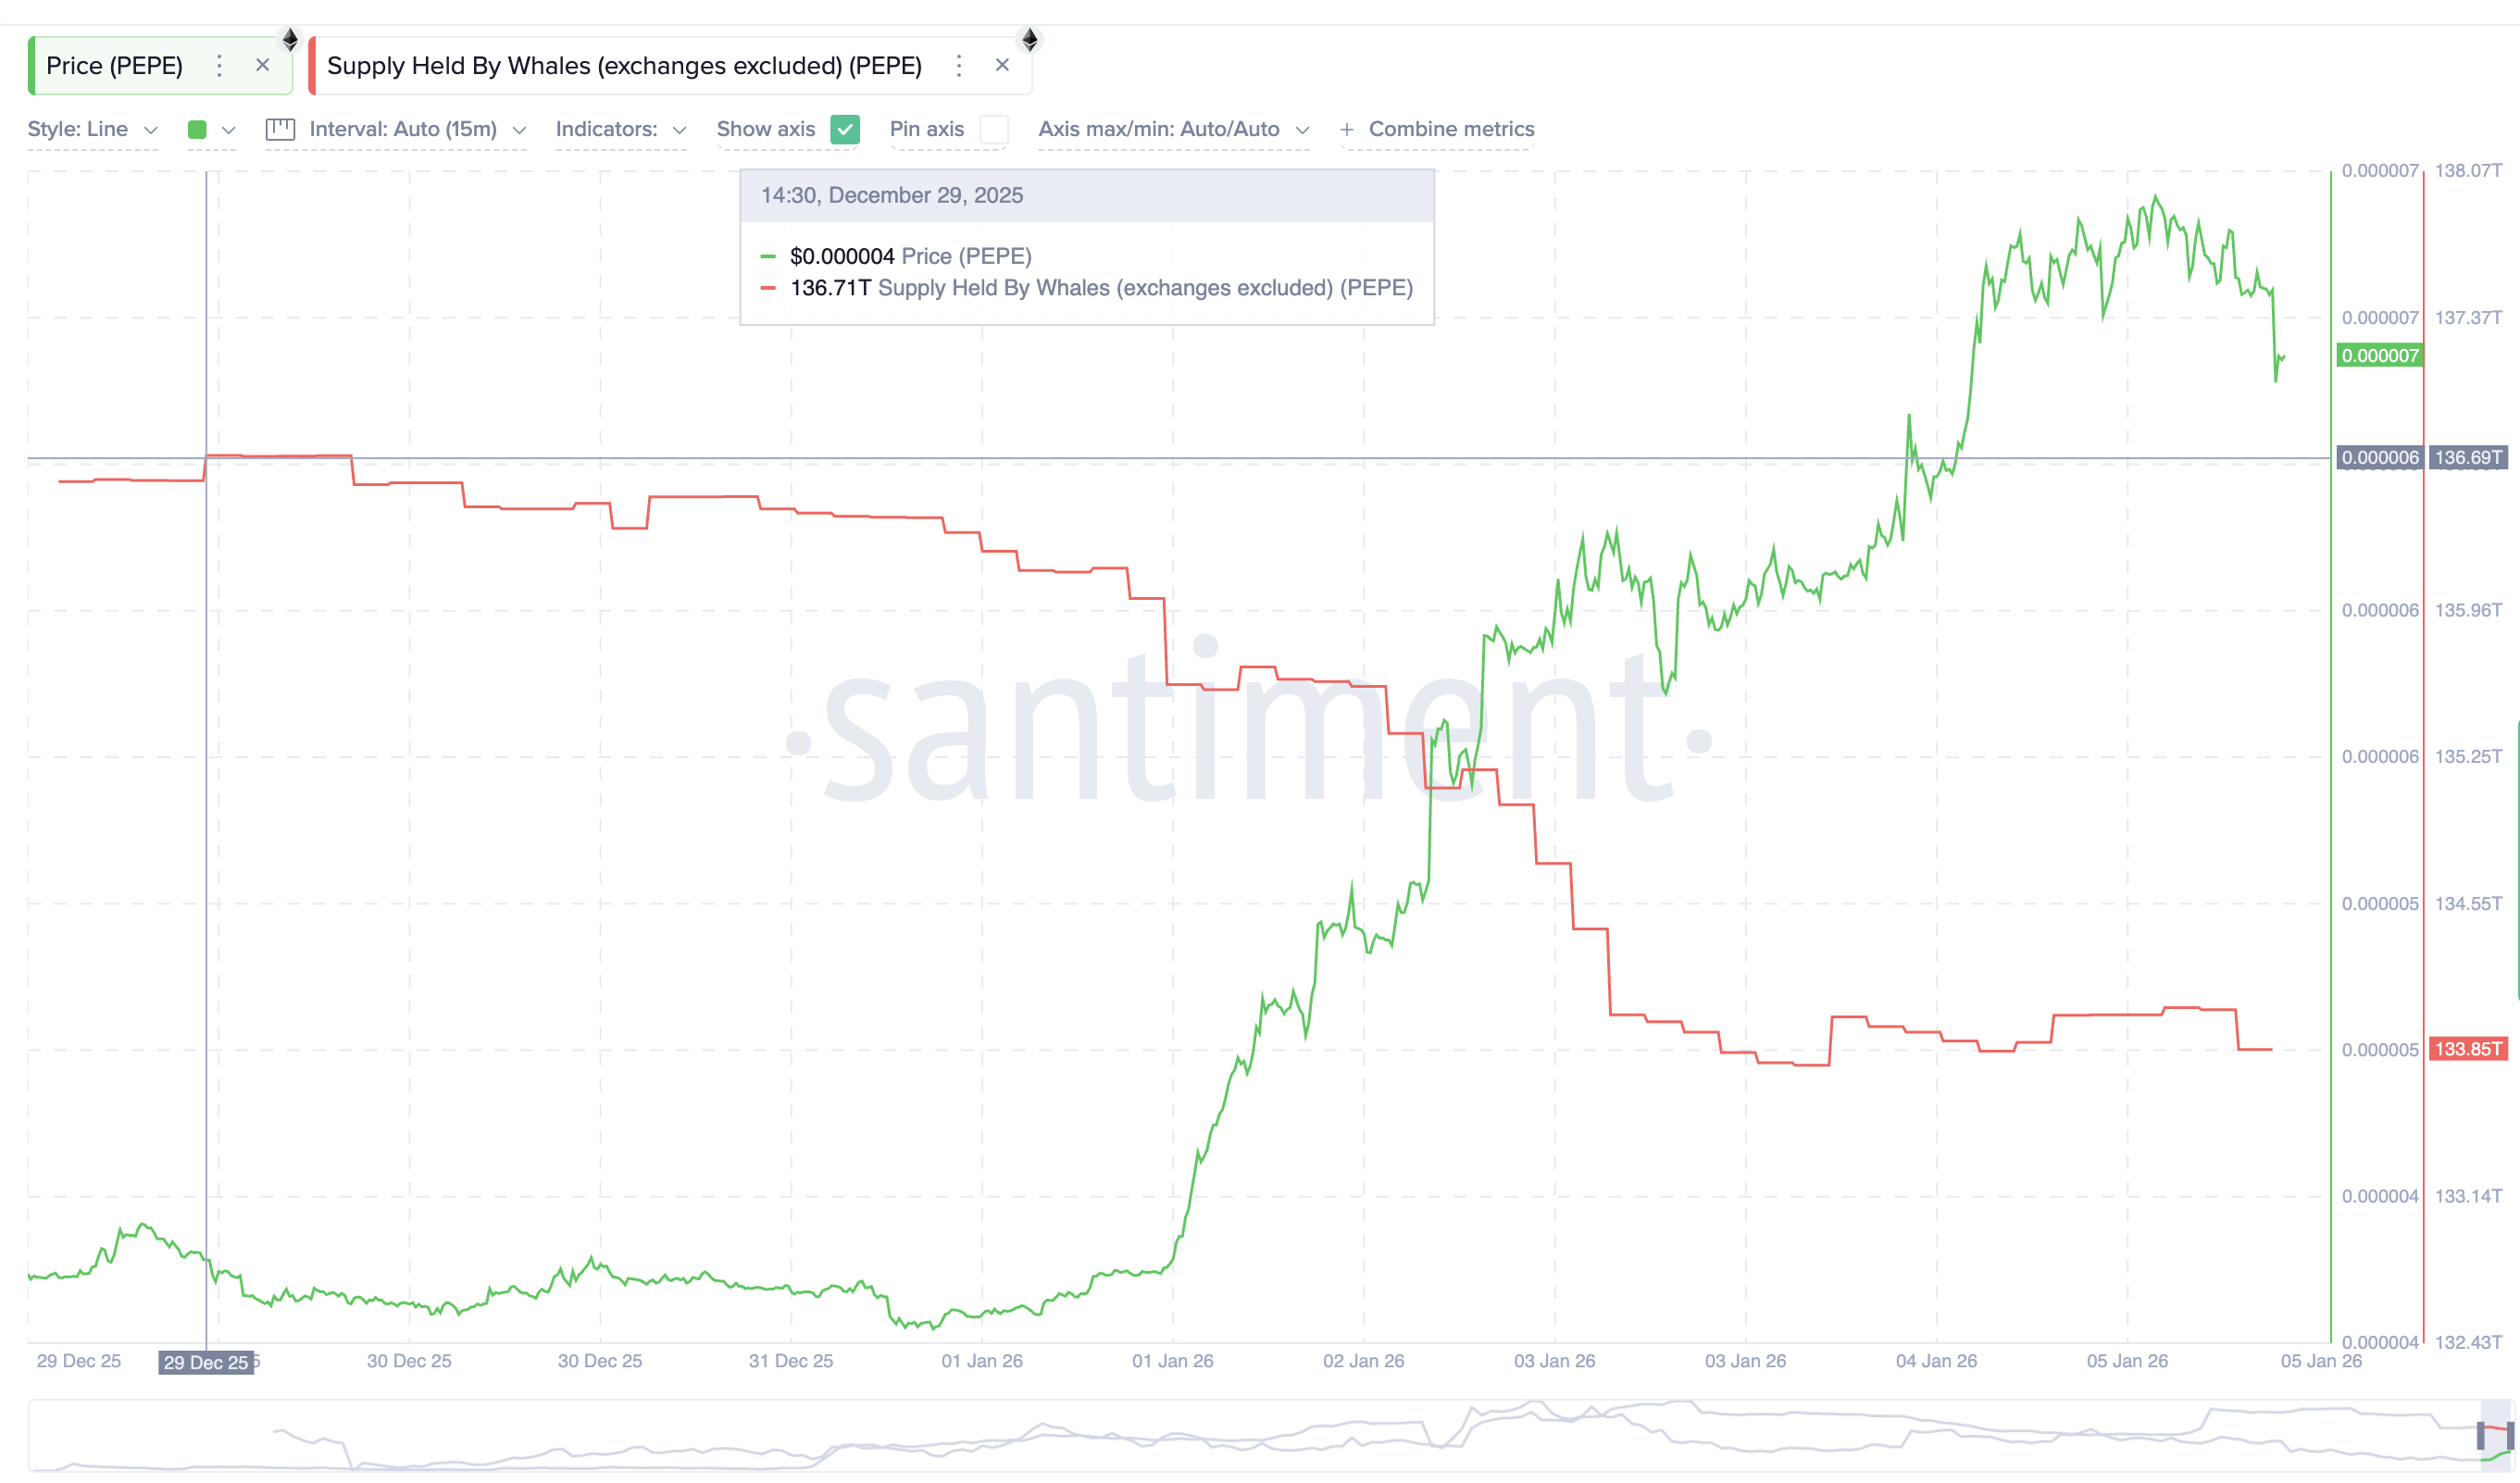
That selling has continued even as the PEPE price moved higher, which is a warning sign. Strong, sustainable rallies are usually backed by whale accumulation, not persistent selling.
Coin movement data reinforces this risk. The spent coins metric, which tracks how many tokens are being moved on-chain across as cohorts, jumped sharply after December 30. Activity rose from about 419 billion PEPE to nearly 1.88 trillion PEPE, despite dropping marginally between January 3-4.
When coin movement spikes during a rally, it often signals distribution and profit booking rather than long-term holding.
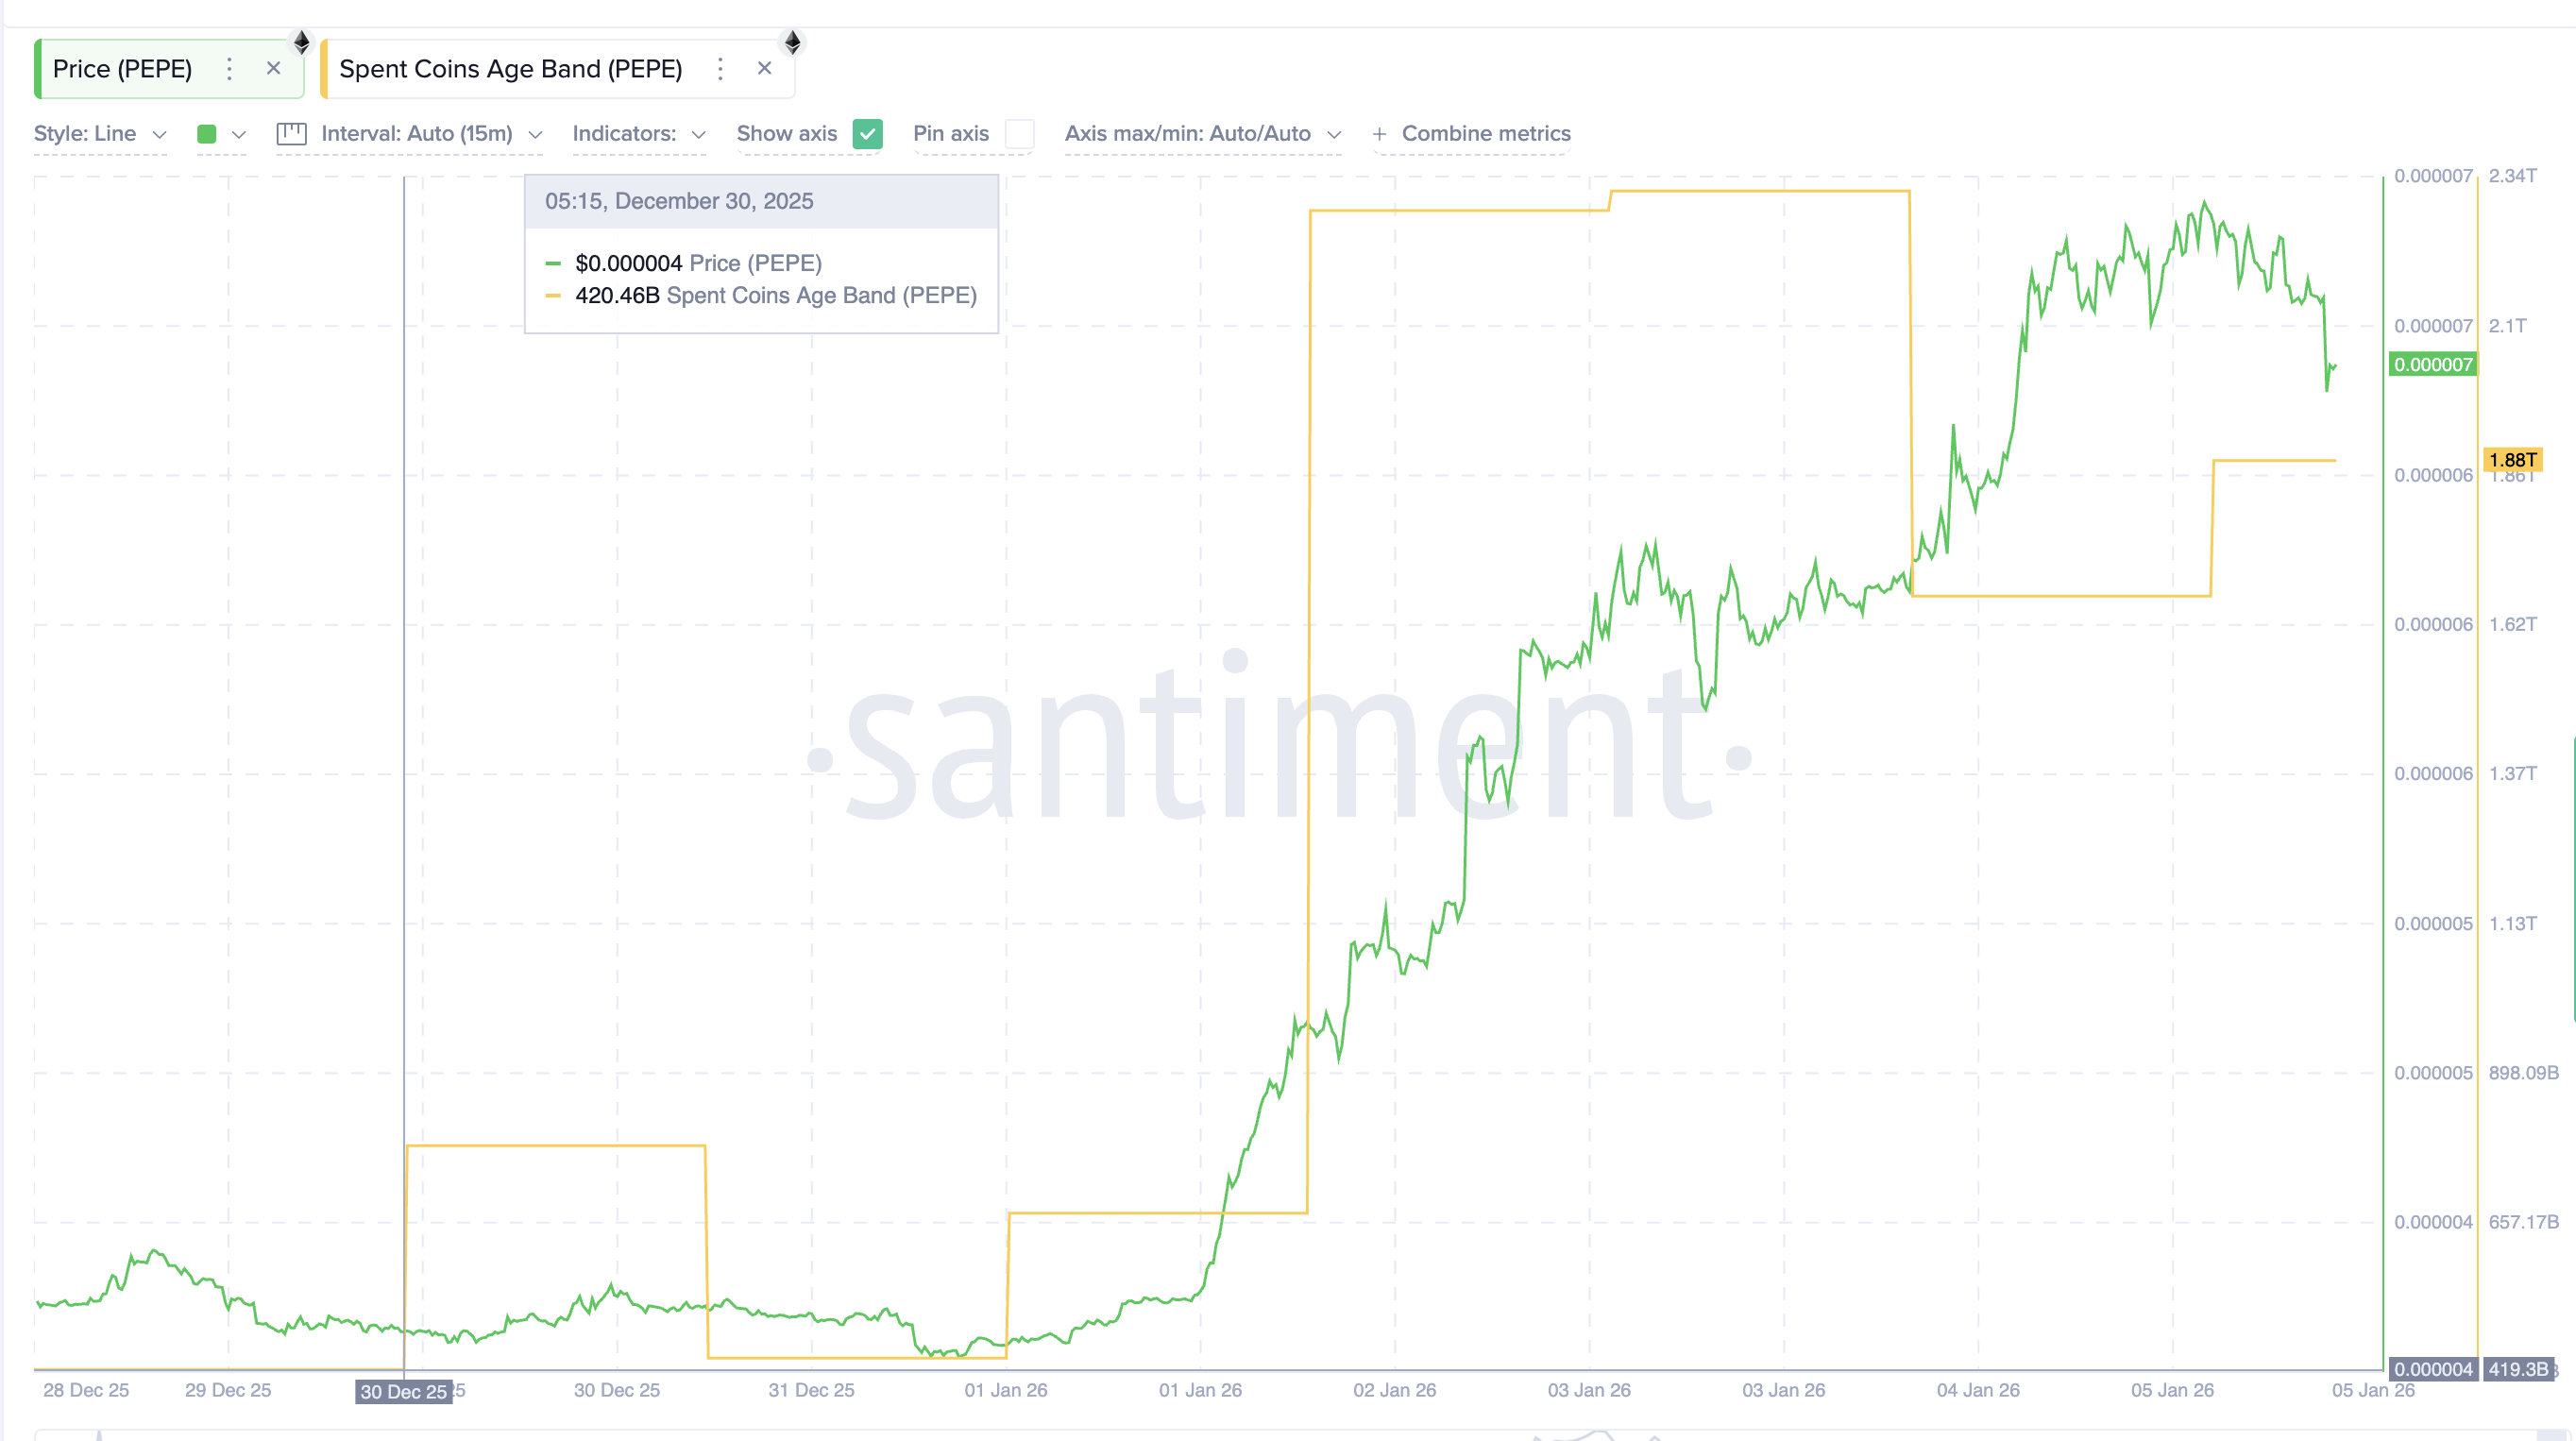
In simple terms, supply is becoming more active (two reasons why the rally looks fragile), not more locked up. That weakens the rally’s foundation. Also, that raises a question that despite spot selling, how did the PEPE price move this high?
Derivatives Explain the PEPE Price Rally — and Why a Sharp Drop Is Possible
If whales were selling, why did PEPE price still rally so aggressively?
The answer likely sits in the derivatives market, the third reason. On the 30-day liquidation map for PEPE perpetual futures, long positions are heavily crowded. Cumulative long liquidation leverage sits near $218 million, while short liquidation leverage is closer to $106 million. That means long exposure is roughly double short exposure.
This imbalance suggests the rally was supposedly fueled partly by short liquidations and aggressive long positioning, rather than strong spot demand. As many shorts were forced out, the PEPE price moved higher quickly.
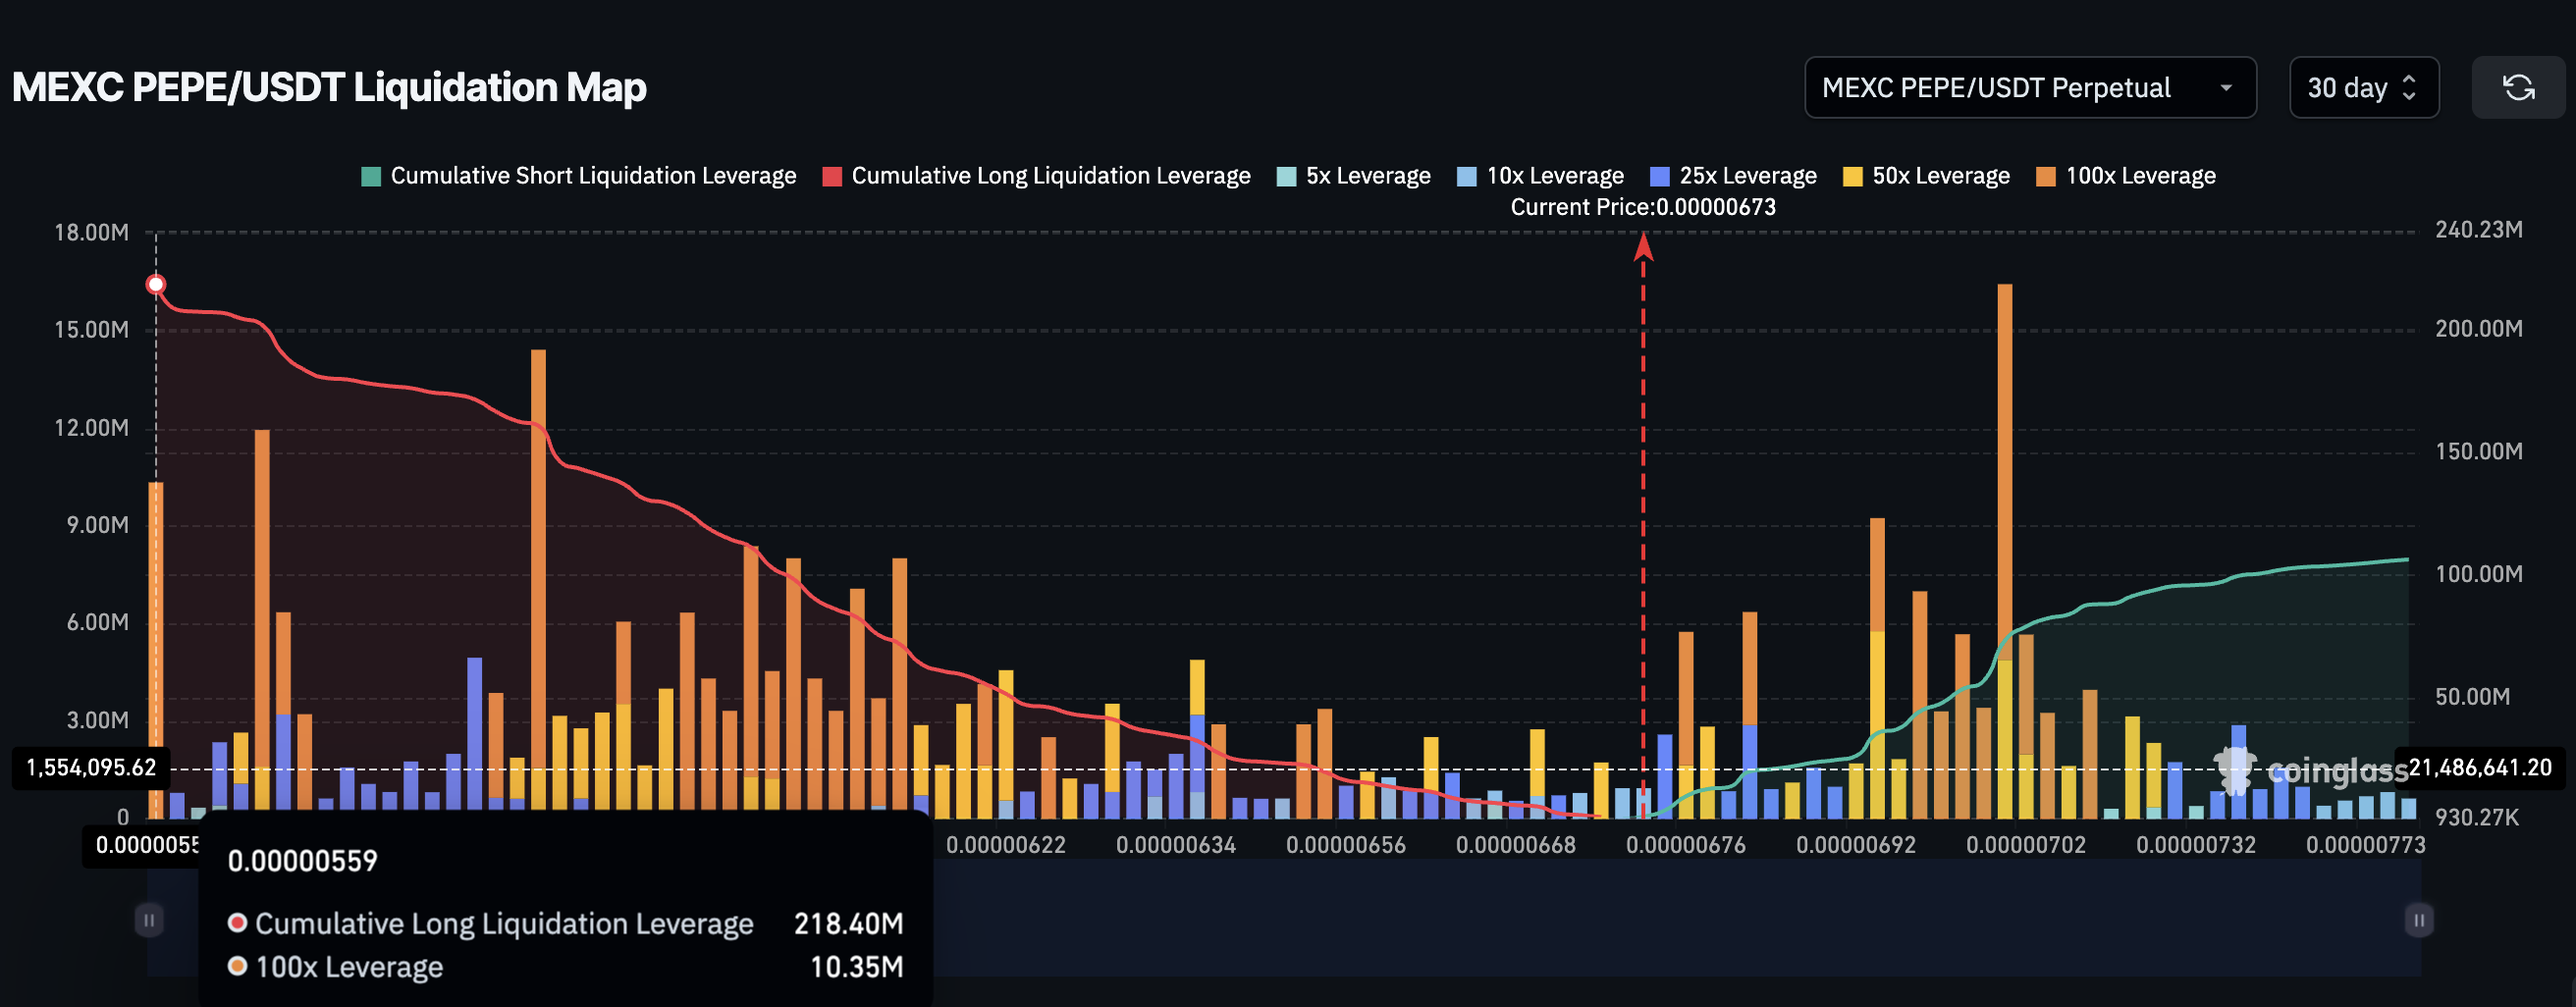
But that same dynamic now creates downside risk. When longs become overcrowded, even a modest pullback can trigger forced selling. If the PEPE price slips below key support, long liquidations can cascade, accelerating losses.
That risk becomes critical near current levels. PEPE price is struggling to hold above $0.0000060. If that level fails, the next downside zone sits near $0.0000046, which would imply a drop of around 30% from recent highs. With whale selling ongoing and coin movement elevated, such a move could happen faster than many expect.
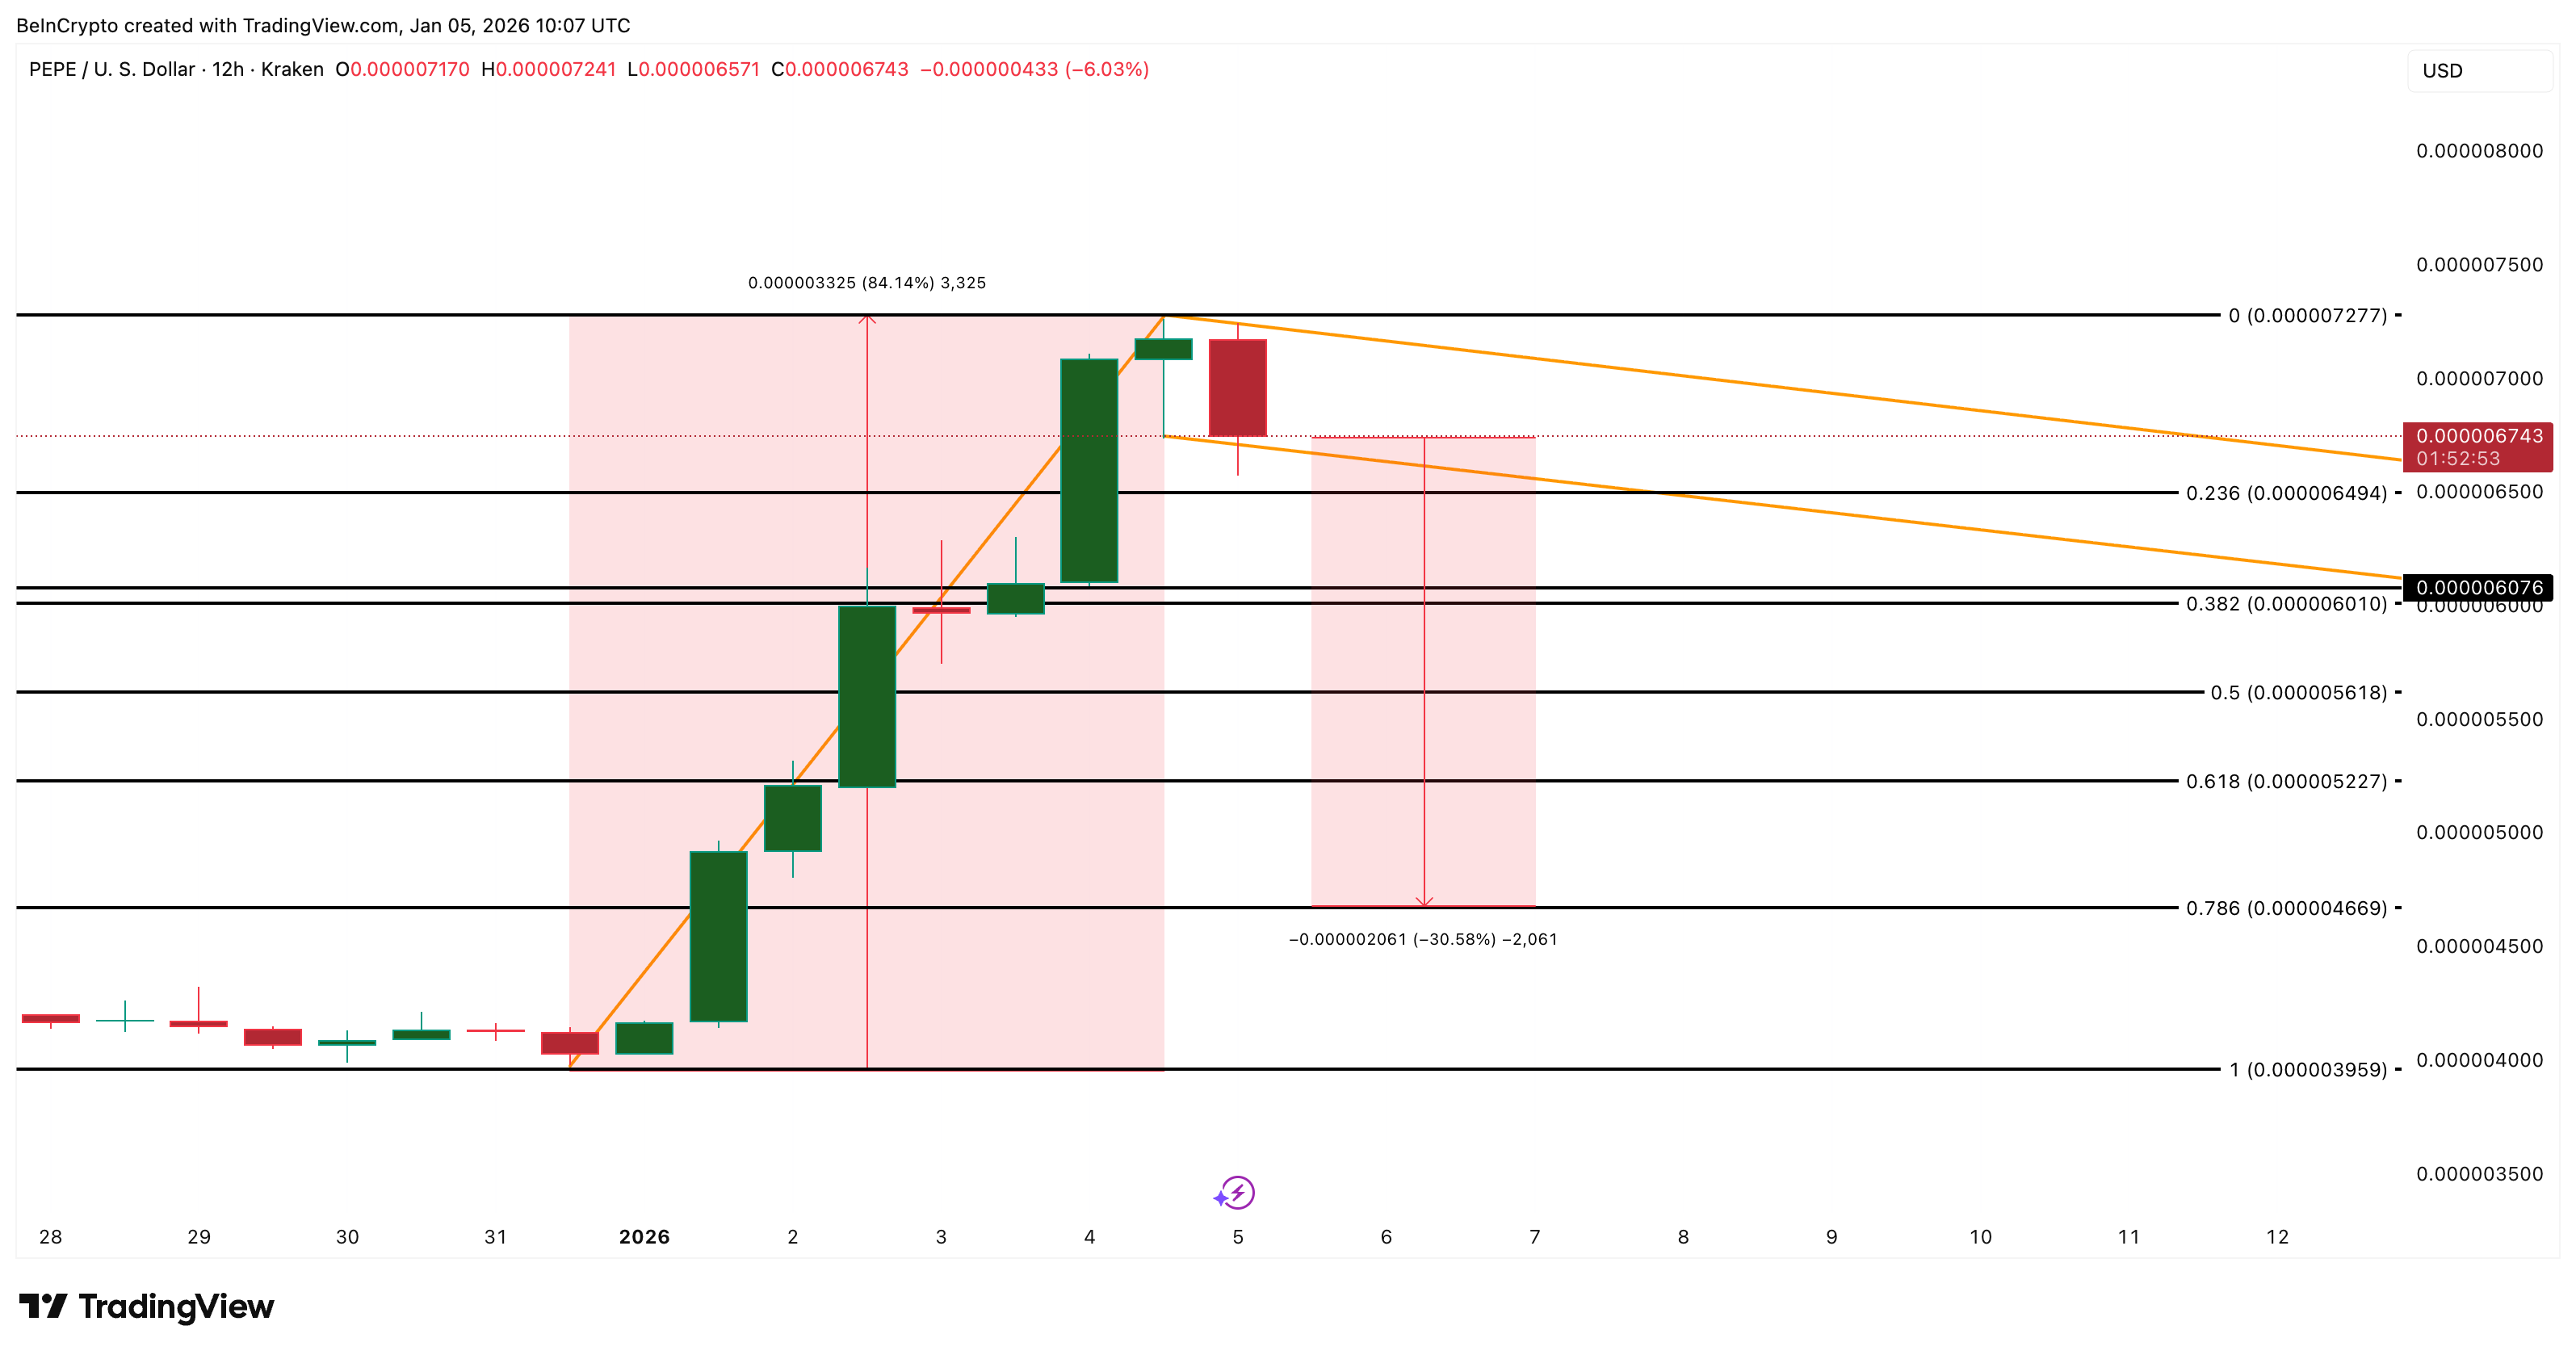
However, a 12-hour close above $0.0000072 would invalidate the bearish angle.
PEPE’s 84% rally looks impressive, but the underlying signals are mixed. The chart structure appears bullish, yet whale distribution, rising coin movement, and crowded long positioning point to fragility rather than strength.
The post 3 Reasons Why PEPE’s 84% Price Rally Could Reverse as Quickly appeared first on BeInCrypto.